
Fleet total cost of ownership (TCO) is the full lifecycle cost of running a vehicle: acquisition, fuel or energy, maintenance, insurance, compliance and downtime, minus what you recover at resale. It is the number that tells you what a fleet actually costs to run, not what it cost to buy.
This guide is the hub of our fleet TCO series. It covers what TCO includes, how to calculate it, the twelve levers that reduce it ranked by payback, and how to prove the saving. Each part links to a deeper guide, and they are all collected at the end.
What is TCO in Fleet Management?
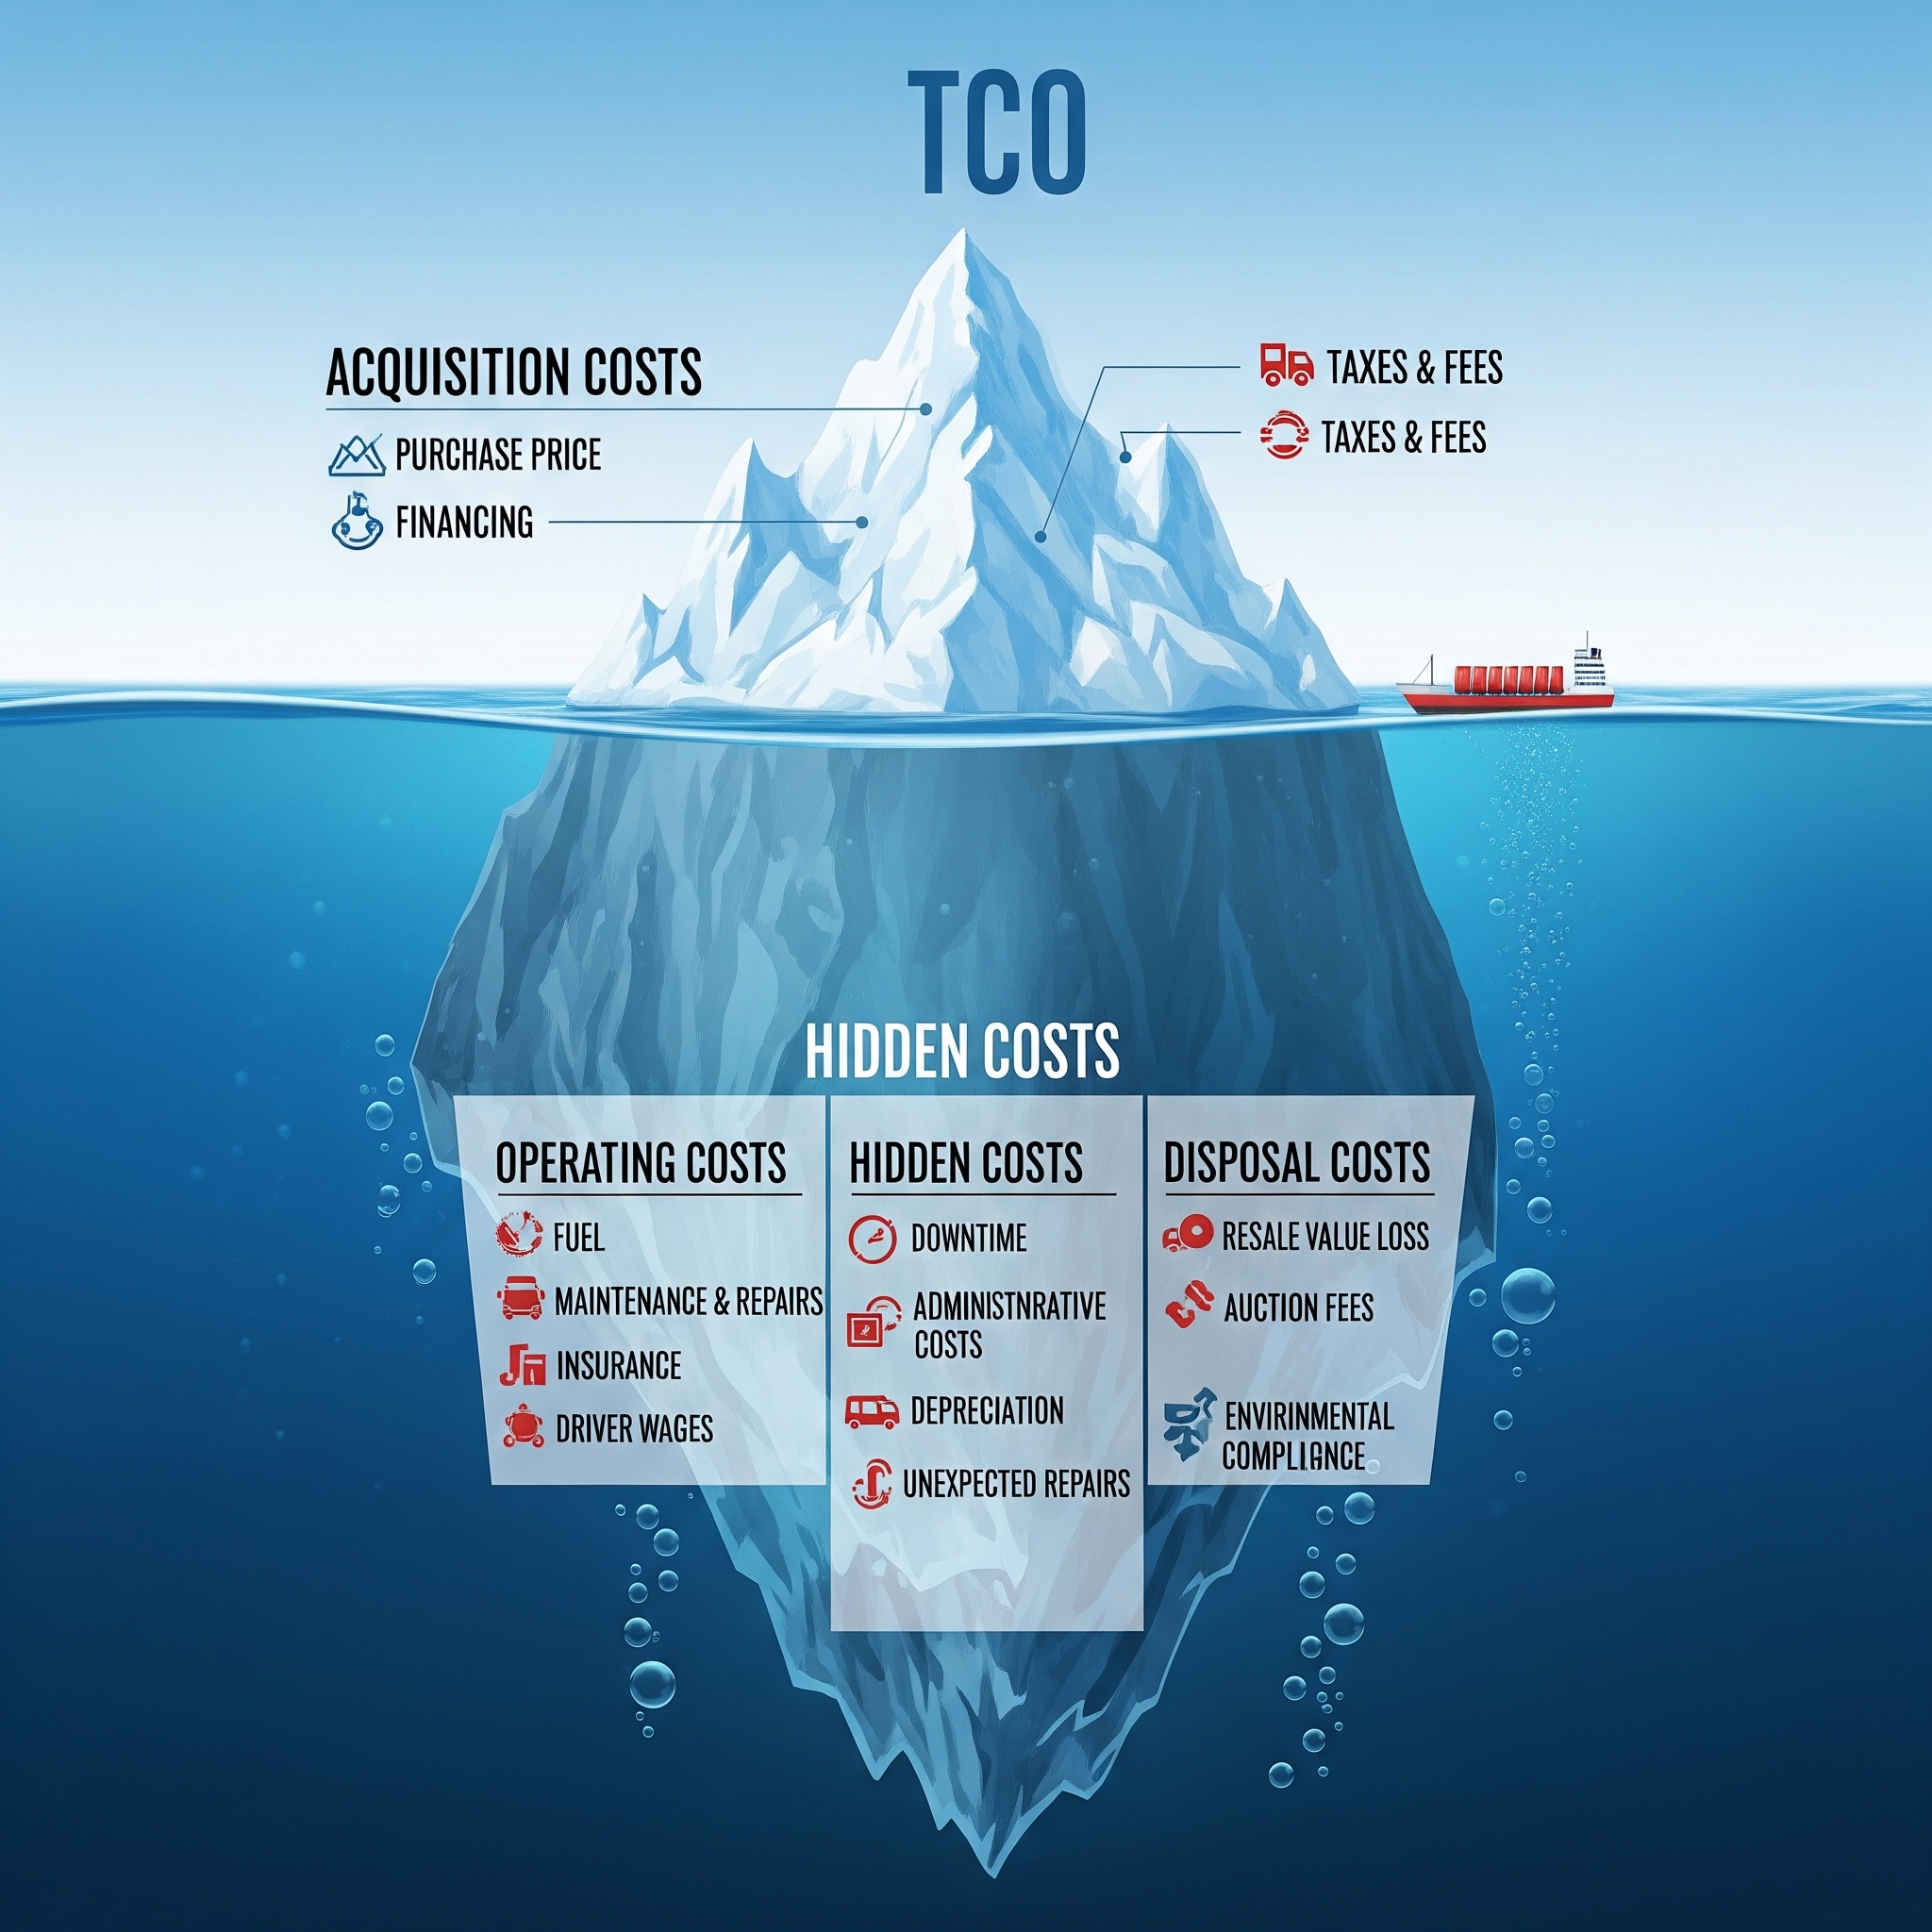
Total Cost of Ownership goes beyond the sticker price of vehicles. It captures the full lifecycle cost of owning and operating fleet assets, including:
- Acquisition costs: Purchase price or leasing fees
- Fuel & energy: Fuel card spend, charging costs, and consumption trends
- Maintenance & repairs: Scheduled servicing and unexpected breakdowns
- Insurance & compliance: Regulatory fees, penalties, and insurance premiums
- Resale value: Depreciation and end-of-life resale
When these costs are measured together, fleet managers gain a much clearer picture of the true financial impact of their operations.
How Do You Calculate Fleet TCO?
The formula is simple to state, even if the data behind it isn't:
Fleet TCO = (Acquisition + Fuel & Energy + Maintenance & Repairs + Insurance & Compliance + Admin) − Resale Value
To compare vehicles fairly, convert it to cost per mile: TCO ÷ lifetime mileage. It is worth also dividing by months held to get cost per month, because the two answer different questions: cost per mile tells you what a vehicle costs to use, cost per month what it costs to keep. A van sitting on the yard has an excellent cost per mile and a terrible cost per month.
A worked example for a cargo van kept for five years and 100,000 miles:
- Purchase price: $38,000
- Fuel over five years: $32,000
- Maintenance, repairs, and tires: $10,000
- Insurance and compliance: $8,000
- Admin, tolls, and miscellaneous: $2,000
- Resale value after five years: −$11,000
TCO = $79,000, or 79¢ per mile. Run the same calculation across your fleet and the differences between vehicles — and the leaks hiding inside the fuel and maintenance lines — become visible for the first time.
For the full method, including every cost line, where each number lives, and the four errors that most often break the figure, see how to calculate fleet TCO, and how to calculate fleet cost per mile for the comparison metric.
Why TCO Is Hard to Measure
On paper, TCO sounds straightforward. In practice, it’s one of the biggest challenges for commercial fleets because the data is scattered across different systems:
- Fuel card providers hold fueling data.
- Telematics systems record mileage, idling, and driving behavior.
- Repair shops and maintenance providers manage service records.
- Finance teams track leasing and insurance costs.
Without integration, managers are forced to rely on spreadsheets and manual analysis — a process that is time-consuming, error-prone, and often incomplete.
How to Reduce Fleet TCO
Two lines dominate fleet TCO. Fuel and energy typically accounts for 30–40% of the total, and depreciation for a similar share, so together they are usually around two thirds of the number. Everything else matters, but a programme that opens with tire procurement or telematics tariffs is optimizing the small end while the big end leaks.
One precondition sits underneath all of it: the data has to be joined. Until fuel, telematics, maintenance and finance data are in one place, most of the levers below can be described but not measured, which is why integration comes before optimization rather than alongside it.
The levers are ordered by how quickly they pay back, not by how large the theoretical saving is.
Weeks 1 to 4: recover money already being lost
- Reconcile fuel against vehicle activity. Match every fuel card and tank transaction to a vehicle that was actually at that location at that time, with a tank that could hold that volume. Mismatches are either data errors or losses, and this is where fuel card fraud and misuse becomes visible. No capital, no policy change, and it is the only lever that recovers money currently walking out of the door. See fleet fuel reconciliation.
- Check maintenance invoices against what the work should have taken. Compare invoiced labor hours to standard times, and part prices to what the same part cost on the last 20 invoices. Overbilling is rarely dramatic; it is a consistent extra half hour repeated across hundreds of invoices.
- Bring fines into the vehicle record. Tickets and violations usually sit in an overhead account. Attributed per vehicle and per driver, the small number of repeat sources becomes obvious, and most of the volume is a route problem rather than a software one.
Months 1 to 3: fix the controls
- Tighten fuel card controls to actual operating patterns. Product restrictions, single-transaction volume caps set slightly above tank capacity, and time limits only where the operation genuinely does not run. Provider defaults are almost always looser than the operation requires.
- Set a maintenance authorization threshold. Work above a stated value needs a second pair of eyes before it is authorized. The threshold matters less than the fact that it exists and is applied consistently.
- Attack idle time. Idle fuel is pure cost with zero output, and it adds engine hours that pull service intervals forward and depress resale value. Telematics already records it, the fix is coaching rather than capital, and a weekly report naming the worst offenders is enough to start.
- Fix underinflation. Tire pressure affects both fuel consumption and tire life, hitting two cost lines at once. Highest ratio of saving to effort on this list, and the most consistently neglected.
Months 3 to 12: structural change
- Right-size the fleet. Rank vehicles by utilization, not age. A vehicle used 40% of available days carries a full depreciation and insurance burden for partial output, however new it is.
- Match specification to duty cycle. Overspecified vehicles cost more to buy, fuel and maintain, and the extra capability is often bought once and never used.
- Time replacement against your own cost curve. The right point is where cost per mile starts rising faster than depreciation is falling, which means weighing residual values and depreciation rather than judging on repair bills alone. A vehicle whose monthly maintenance exceeds the cost of replacing it is past that point, and the crossover is specific to your duty cycle rather than readable off a generic schedule. See when to replace fleet vehicles.
- Consolidate suppliers where it buys leverage, not just simplicity. Fewer fuel cards and maintenance suppliers improve rate negotiation and make anomaly detection possible, because you have enough volume per supplier to establish what normal looks like.
- Reduce downtime. Every off-road day is a rental cost or lost contribution. Servicing scheduled on actual telematics mileage rather than fixed dates prevents the breakdowns that take vehicles off the road unexpectedly, and work planned around operational troughs, parts checked before the vehicle goes in, and defects reaching the shop same-day all cut downtime without buying anything.
Several of these only become practical at scale with automation: anomaly detection across fuel and maintenance transactions, and recurring cost reporting that would otherwise take hours to assemble by hand.
What Not to Start With
Three things get proposed early and rarely pay back early:
- Renegotiating cents-per-gallon discounts. Worth doing at renewal, but the gap between a good and an average rate is small next to the gap between reconciled and unreconciled volume.
- Electrification for cost reasons alone. It reshapes TCO rather than automatically lowering it, and the answer depends heavily on duty cycle and charging arrangement. See EV vs diesel fleet TCO and the fleet electrification roadmap before committing on cost grounds.
- Replacing the telematics provider. The data you already have is almost never fully used, and switching resets your baseline while delaying every other lever here.
Proving the Reduction
Baseline cost per mile and cost per month per vehicle class before you change anything, then track the same two measures monthly. Savings claimed against a modeled counterfactual rather than a measured baseline do not survive scrutiny, and a target percentage borrowed from someone else's fleet tells you nothing about the opportunity in yours. For the reporting views that make the saving credible to a board, see fleet TCO reporting for CFOs; to carry it into next year's numbers, see fleet budgeting and forecasting.
#1 AI-powered fleet spend control platform
Ready to Stop Losing Money on Fleet Spend?
See how much you could save in the first week. Start your free trial today. Cancel anytime.
Fleevo’s Role in TCO Optimization
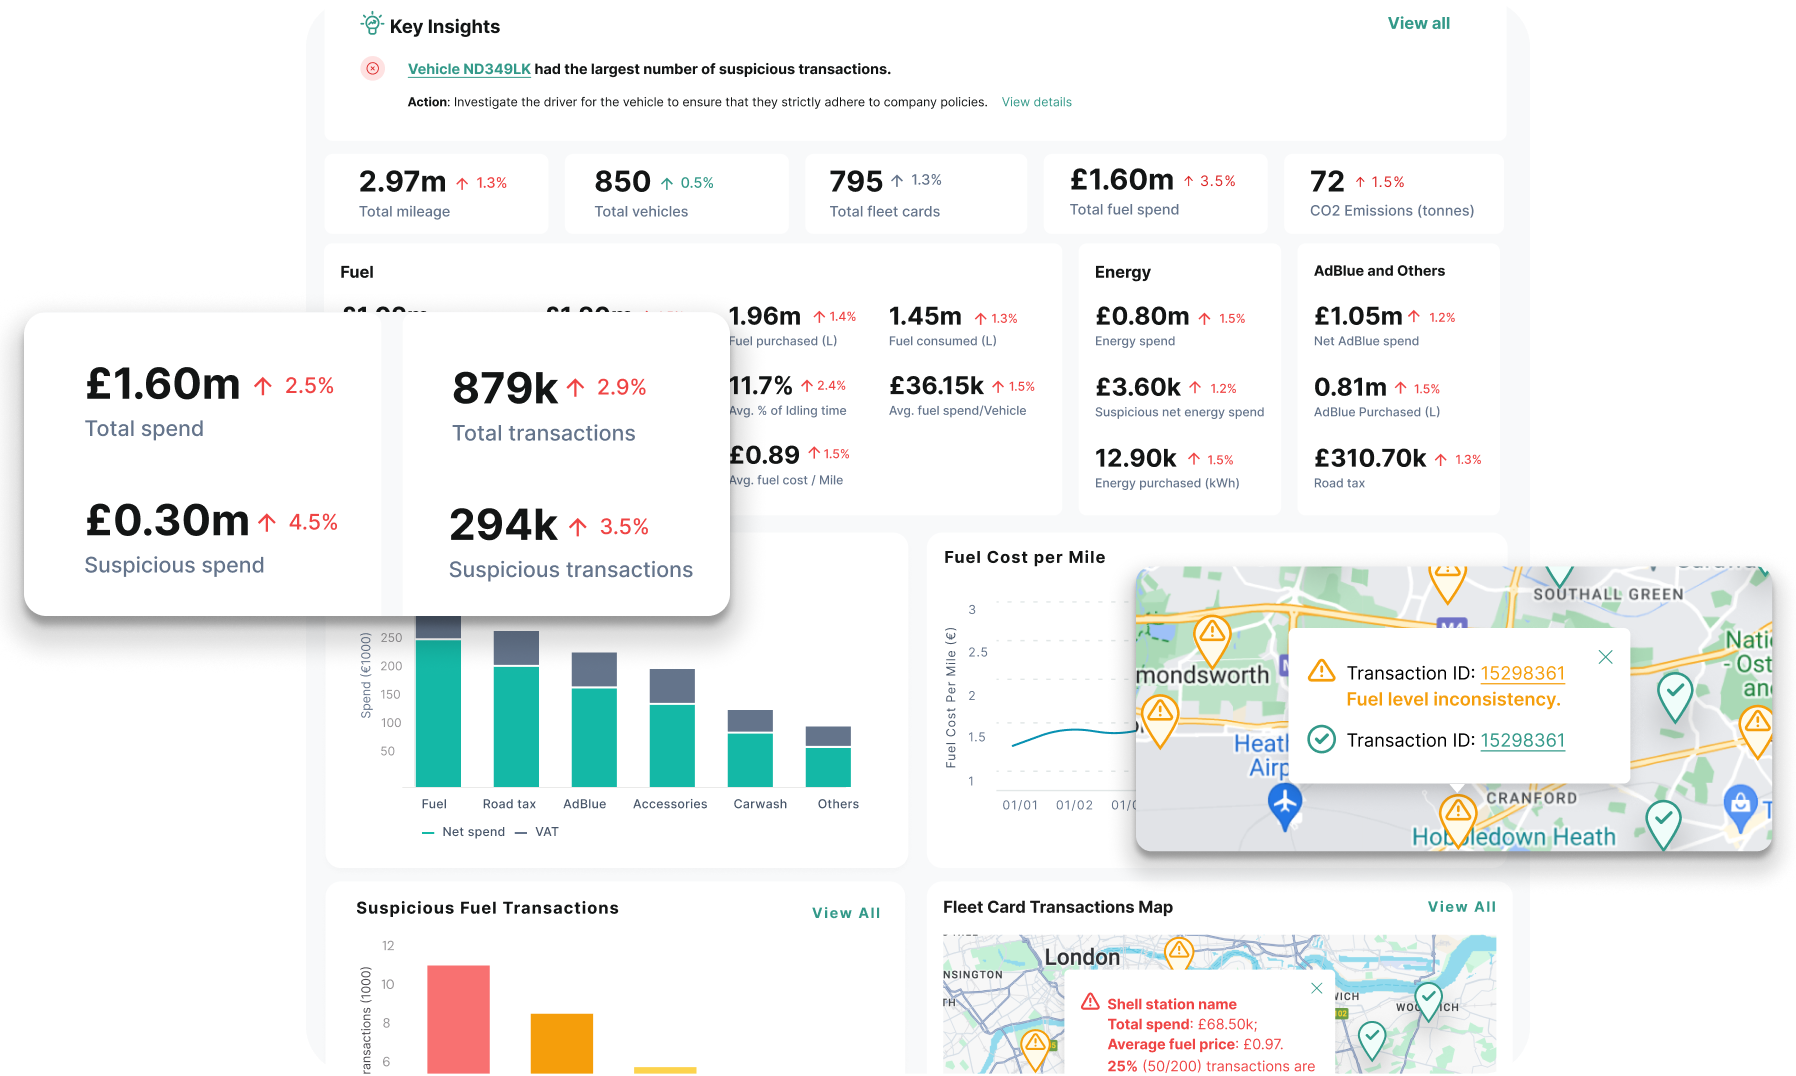
At Fleevo, we help fleets tackle the complexity of TCO by connecting siloed data across systems into one AI-powered platform. Instead of juggling spreadsheets and multiple dashboards, fleet managers can quickly see where costs are rising, identify inefficiencies, and make data-driven decisions that cut expenses and improve sustainability.
The Future of TCO in Fleets
As fleets transition toward electrification and alternative fuels, TCO will become even more critical. New cost factors like charging infrastructure, battery health, and energy tariffs will reshape decision-making. Fleets that master TCO today — with the help of data integration and automation — will be better positioned to thrive in this evolving landscape.
What Is Included in Fleet TCO?
Fleet TCO is built from the cost lines below. All are added together except resale value, which is subtracted. The second column is the part most fleets struggle with: knowing which system actually holds each number.
- Acquisition — purchase price, or leasing and finance charges over the term. Source: purchase invoice or lease schedule.
- Finance cost — the interest element, worth separating from depreciation so owned and leased vehicles compare on the same basis. Source: loan amortisation or the finance component of the rental.
- Fuel and energy — fuel card spend, onsite tank draw, and EV charging across depot, home, and public sessions. Source: card statements, tank dispensing records, and charge point sessions, reconciled against each other.
- Maintenance and repairs — scheduled servicing, unplanned breakdowns, and consequential damage. Keep scheduled and unscheduled separate, or you cannot tell a maintenance problem from a driver behaviour problem. Source: workshop invoices, split to labour, parts and consumables.
- Tyres — worth its own line, because tyre cost per mile is one of the cleanest early indicators that a route or driver profile has changed. Source: tyre supplier invoices.
- Insurance — premiums, plus the excess actually paid on claims in the period. Source: premium allocation per vehicle.
- Admin, tolls and taxes — road tax, tolls, clean air and congestion charges, AdBlue, and the staff time spent reconciling all of it. Source: toll and zone accounts, plus hours per vehicle at a loaded rate.
- Fines and compliance — PCNs, penalty notices, and the time to process them. Most fleets book these to an overhead account, so they never reach a vehicle record. Source: the notices themselves, attributed per vehicle.
- Downtime — off-road days multiplied by either the daily cost of a replacement or the daily contribution that vehicle normally earns. The line most often omitted, and often the one that separates two otherwise identical vehicles. Source: workshop and VOR records.
- Resale value — subtracted, being depreciation recovered at end of life. Source: a residual forecast, refreshed at least twice a year, then actual disposal proceeds.
Of these, fuel and energy is both the largest controllable line and the one most exposed to fraud and misuse, which is why it is usually where a TCO programme starts. Attributing every cost line to the right vehicle or cost centre is a job in itself; see fleet cost allocation. A stale residual assumption is the most common reason a TCO model quietly stops matching reality.
Fleet TCO FAQs
Is TCO the same as cost per mile?
Not quite. TCO is the total lifecycle cost of a vehicle; cost per mile is TCO divided by lifetime mileage. Cost per mile is the more useful number for comparing vehicles, routes, and replacement decisions.
What percentage of fleet TCO is fuel?
Fuel and energy typically account for 30–40% of fleet TCO — the largest controllable cost, and the one most exposed to fraud, misuse, and unaccounted fuel.
Should leased vehicles be included in fleet TCO?
Yes. Split the rental into its depreciation, finance and maintenance components so leased and owned vehicles compare on the same basis. Excluding leased vehicles makes the fleet figure meaningless if any material share of the fleet is on contract.
How often should you review fleet TCO?
Quarterly at minimum, and always before replacement decisions. Fleets with integrated data review it continuously — TCO dashboards update as fuel, maintenance, and telematics data flows in.
How do service plans lower fleet TCO?
A fixed-price service plan turns unpredictable repair spend into a known cost, and lowers TCO in four ways: it caps exposure to rising labour rates and parts markups, keeps vehicles on the manufacturer’s schedule so warranty and resale value are protected, catches wear early enough to avoid consequential damage, and reduces unplanned off-road time. The saving is not automatic. A plan priced above your actual repair history will raise TCO rather than lower it, so compare the plan cost per vehicle per year against your own maintenance spend per vehicle before committing. See do service plans lower fleet TCO? for the full breakdown.
What makes a fleet solution low TCO?
A low-TCO fleet is one where the cost over the vehicle’s whole life is lowest, not the one with the cheapest purchase price. In practice that means vehicles matched to their actual duty cycle rather than over-specified, fuel and energy audited rather than assumed, maintenance planned rather than reactive, utilisation high enough to spread fixed costs across more miles, and replacement timed before repair costs overtake the savings from delaying depreciation. Visibility is the precondition for all five: you cannot lower a cost you cannot see at the individual vehicle level.
Bottom line: TCO isn’t just an accounting exercise. It’s the key to unlocking efficiency, cost savings, and long-term sustainability in fleet operations. With the right tools and insights, fleets can move from reactive cost control to proactive, data-driven strategy.
The Fleet TCO Series
This pillar links to a deeper guide on each part of fleet TCO:
- How to calculate fleet TCO — the formula, all ten cost lines, and the four errors that break the figure
- Fleet cost per mile — the metric for comparing vehicles fairly
- Fleet TCO reporting for CFOs — the six views a board needs, and the traceability that survives audit
- Fleet budgeting and forecasting — carrying TCO into next year's numbers
- Fleet cost allocation — cost centres and chargebacks
- EV vs diesel fleet TCO — line by line, which costs fall and which rise
- Fleet electrification roadmap — how to transition without guesswork
- Do service plans lower fleet TCO? — when a fixed-price plan pays back
- When to replace fleet vehicles — timing replacement against your own cost curve
- TCO fleet management: 3 ways to reduce costs
Explore the platform: Fuel & Energy Management · Maintenance Spend Control · reduce fleet TCO · how to calculate cost per mile
Read customer story: See how Egertons Recovery strengthened fuel oversight with Fleevo.