

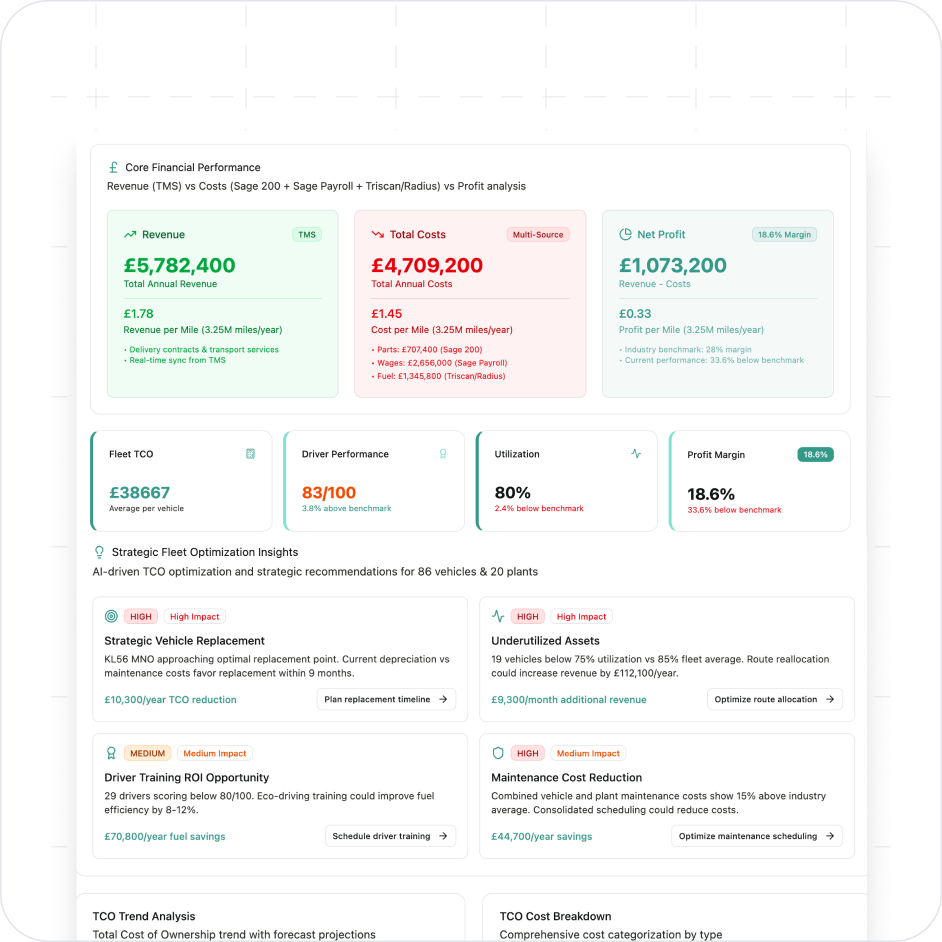
Cost per mile is total vehicle cost for a period divided by the miles covered in that period. It is the only measure that lets you compare a van doing 4,000 miles a month with one doing 900, and it is the number that tells you whether a vehicle is expensive or simply busy.
Cost per mile = (fixed costs + variable costs) / miles covered
The difficulty is not the arithmetic. It is deciding what goes in the numerator and getting a trustworthy odometer figure for the denominator.
Fixed and variable, and why the split matters
Fixed costs accrue whether or not the vehicle moves: depreciation, finance, insurance, VED, operator licence apportionment, and telematics subscription.
Variable costs accrue with use: fuel or energy, tyres, maintenance and repair, tolls, and AdBlue.
Keep them separate in your reporting, because they answer different questions. Rising variable cost per mile points at driving, routing, or vehicle condition. Rising fixed cost per mile usually means the vehicle is not being used enough to carry its own standing cost, which is a fleet sizing question rather than an operational one.
Getting the denominator right
Most cost per mile figures are wrong because of the mileage, not the money. Three sources, in order of reliability:
- Telematics odometer. Continuous and hard to fudge. The best source where available.
- Fuel card odometer prompts. Driver entered, so prone to typos and rounded guesses. Useful as a cross check, not as a primary source.
- Service records. Accurate but only available a few times a year, so it cannot support monthly reporting.
If you have telematics on part of the fleet only, report cost per mile for that part and cost per month for the rest, clearly labelled. A blended figure built on two different mileage sources will not hold up when someone checks it.
Handling a mixed fleet
Never compare cost per mile across vehicle classes. A 44t tractor unit and a car derived van have no business being in the same league table. Group by class and duty cycle, then compare within the group:
- Group by body type and gross vehicle weight
- Split by duty cycle, because urban multi drop and trunking produce completely different cost profiles for the same vehicle
- Report the median for the group, not the mean, so one catastrophic repair does not move the benchmark
The output that drives action is not the fleet average. It is a ranked list within each group, with the top and bottom decile named.
A worked example
Illustrative figures for one month, one 3.5t van covering 2,100 miles:
- Depreciation: 437
- Finance: 71
- Insurance: 96
- Tax and licence: 22
- Fuel: 298 litres at 1.55 = 462
- Maintenance accrual: 92
- Tyre accrual: 27
- Tolls and zone charges: 34
Total 1,241. Cost per mile 0.59, of which fixed is 0.30 and variable is 0.29.
If the same van covers 900 miles the following month with no other change, cost per mile jumps to roughly 0.95 while variable cost per mile barely moves. That is not a cost problem. It is a utilisation problem, and the split makes it visible immediately.
Three errors that make the number useless
1. Using invoiced maintenance spend in the month it was invoiced. A 2,400 repair in March makes March look catastrophic and every other month look fine. Accrue maintenance across the period it relates to.
2. Excluding downtime. A vehicle off the road covers no miles, so its cost per mile inflates for reasons that have nothing to do with efficiency. Report VOR days alongside cost per mile so the two can be read together.
3. Mixing currencies, units, or fuel types silently. Litres and gallons, or diesel and kWh, in the same column produce a number that looks plausible and is wrong. Normalise to a single energy unit and a single currency before dividing.
How to use cost per mile
- Compare vehicles within class. Find the assets costing far more than their peers.
- Price work accurately. Know your true cost before quoting a route or contract.
- Time replacements. Rising cost per mile against falling depreciation is the replacement signal.
- Track the trend. A rolling three month figure catches creep that a single month hides.
#1 AI-powered fleet spend control platform
Ready to Stop Losing Money on Fleet Spend?
See how much you could save in the first week. Start your free trial today. Cancel anytime.
How Fleevo calculates cost per mile
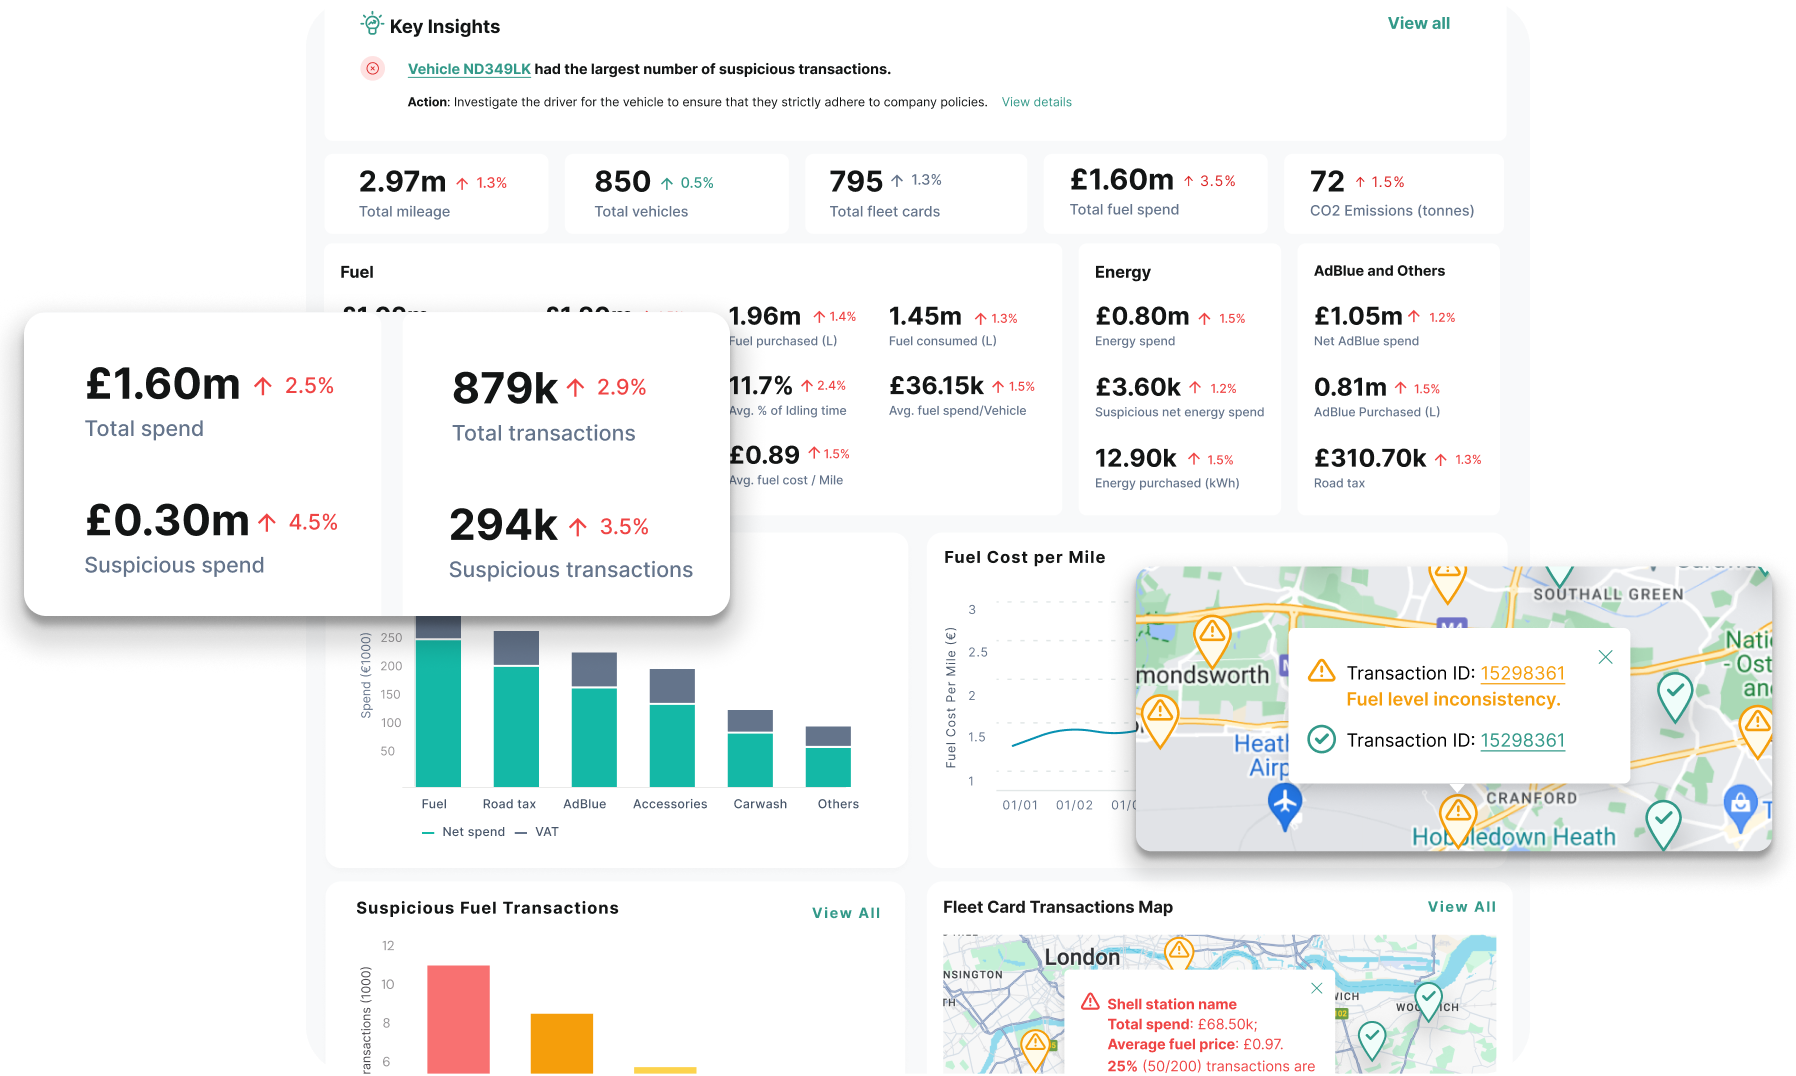
Cost per mile needs mileage and cost joined per vehicle per month, which means telematics, fuel cards, tanks, charge points and maintenance invoices have to agree with each other. Fleevo maintains that join continuously and reports fixed and variable cost per mile by vehicle class, so the ranked list is available on demand rather than rebuilt in a spreadsheet each quarter. Explore Fleet TCO, or read the full guide to total cost of ownership.
Frequently asked questions
What is a good cost per mile for a fleet?
There is no useful cross industry benchmark, because the figure depends on vehicle class, duty cycle, geography, and fuel price at the time. The meaningful comparison is against your own vehicles in the same class, and against your own trend over the last 12 months.
What is the difference between cost per mile and TCO?
Total cost of ownership is the full lifecycle cost of a vehicle. Cost per mile is that cost divided by miles covered, which makes vehicles and routes directly comparable.
Should driver wages be in cost per mile?
Include them if you are pricing work or comparing routes, because labour is usually the largest cost in that context. Exclude them if you are comparing vehicles, since driver cost tells you nothing about the asset.
How do I calculate cost per mile for electric vehicles?
The same way, with energy replacing fuel. The complication is that charging cost per kWh varies enormously between depot, public rapid, and home charging, so energy cost has to come from actual session data rather than an assumed tariff.
How often should cost per mile be reported?
Monthly, with a rolling three month figure alongside it. The single month number is too noisy to act on by itself, and the rolling figure is what shows a genuine trend.
How do you reduce cost per mile?
Attack the largest variable costs first, usually fuel and maintenance, catch waste and overbilling at transaction level, and replace vehicles whose cost per mile has climbed past the median for their class.