
A CFO needs fleet TCO reporting that supports three decisions: whether to keep or replace an asset, whether the fleet is the right size, and whether cost is being controlled or merely recorded. Most fleet reporting answers none of these, because it reports spend by category rather than cost by asset.
The gap is structural. Fleet reporting is built from operational systems organised around vehicles and events. Finance reporting is built from a ledger organised around accounts and periods. Neither, on its own, produces cost per asset per period, which is the thing every decision above needs.
The six views worth building
1. Cost per mile and cost per month, by vehicle, within class. Ranked, with the top and bottom decile named. This is the primary view. It supports the keep or replace decision directly and needs no interpretation.
2. Fixed versus variable cost split. Rising variable cost points at driving, condition or routing. Rising fixed cost per mile points at under-utilisation, which is a fleet sizing question. Without the split, the two are indistinguishable and get the wrong response.
3. Utilisation against cost. Days used against days available, alongside cost per month. Vehicles carrying full standing cost for partial output are the right-sizing candidates, and age is a poor proxy for this.
4. Cost trend by class over 12 months, rolling. Single month figures are too noisy for a board. A rolling view distinguishes genuine drift from a lumpy servicing month.
5. Exception value. What was identified, what was recovered, and what remains unexplained, across fuel, maintenance and fines. This is the view that shows control rather than recording, and it is the one most often absent.
6. Forecast against actual, by cost line. Split by the lines that behave differently: depreciation is predictable, fuel moves with price and activity, maintenance is back loaded by vehicle age. A single fleet cost variance tells you nothing about which of these moved.
The traceability test
The question that separates usable reporting from a presentation: take any figure and trace it to source transactions. A fuel cost per mile figure should decompose to individual transactions, each attributable to a vehicle, with the mileage source identified.
Reporting that cannot survive this is not reportable externally. It also cannot be relied on internally, because a figure nobody can reconstruct is a figure nobody will defend when it is challenged.
What to stop reporting
- Fleet average cost per mile as a headline. It hides the distribution, which is the only actionable part. Report the median within class plus the outliers.
- Total fuel spend without volume. Spend moves with price. Volume moves with behaviour and efficiency. Reporting only spend makes a price movement look like an operational result, in both directions.
- Maintenance spend by invoice date. Accrue it, or every report is dominated by the timing of when invoices happened to arrive.
- Savings claimed against a modelled counterfactual. Baseline and measure, or do not claim. Counterfactual savings do not survive the first serious question.
The uncomfortable finding to expect
The first time this reporting runs properly, two things usually surface: a group of vehicles whose cost per mile is far worse than the class median and has been for some time, and a quantity of fuel or energy that cannot be attributed to any vehicle. Both are normal first findings. Both are also the reason the reporting is worth building, and neither is visible in category spend reporting.
It is worth setting the expectation before the first run, because the unattributed volume figure in particular tends to arrive as a surprise.
#1 AI-powered fleet spend control platform
Ready to Stop Losing Money on Fleet Spend?
See how much you could save in the first week. Start your free trial today. Cancel anytime.
Building These Views In Fleevo
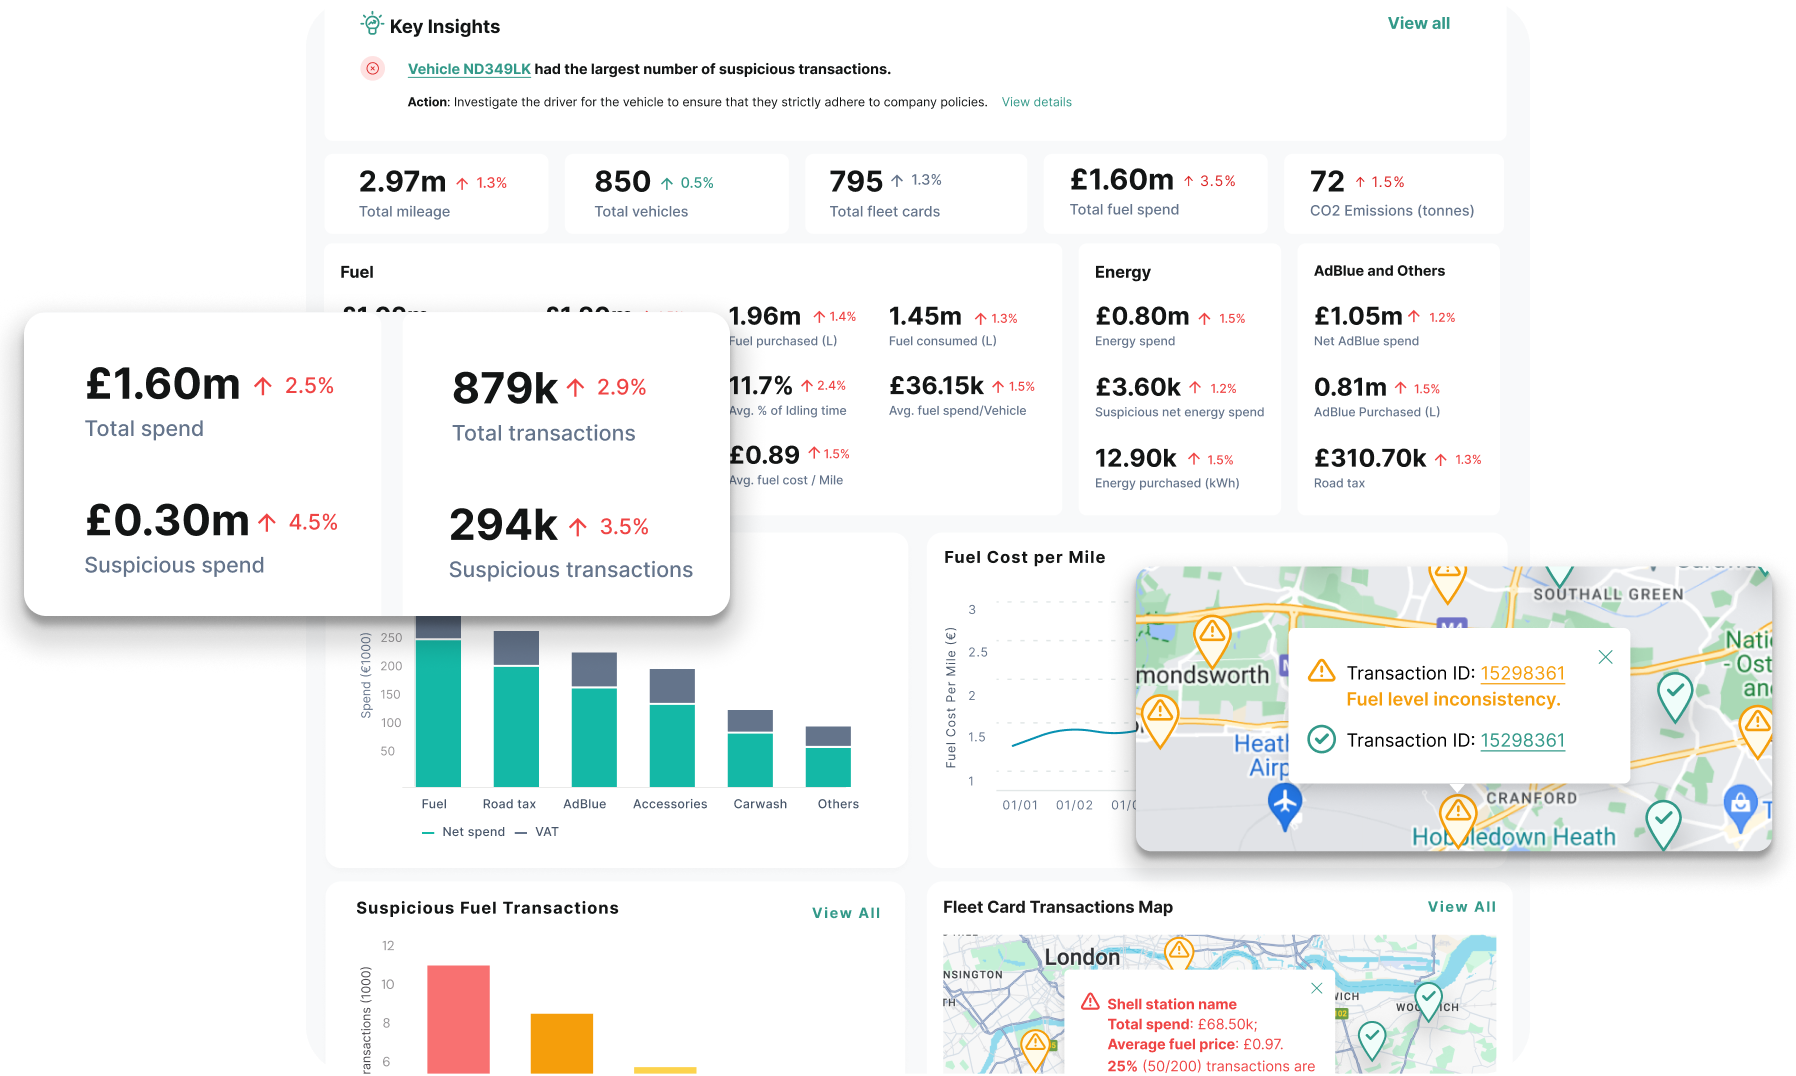
Fleevo builds all six views from one dataset: telematics, fuel cards, onsite tanks, charge points, maintenance invoices and fines joined per vehicle per period. Every figure decomposes to the underlying transactions, which is what makes it defensible in a board pack and in an audit. To see the views against your own data, contact Fleevo or book a demo. See also Fleet TCO, tailored KPI reporting, and how to calculate fleet TCO.
Fleet TCO Reporting FAQs
What should a fleet TCO reporting tool have for a CFO audience?
Cost per mile and per month by vehicle within class, a fixed versus variable split, utilisation against cost, a rolling 12 month trend, exception value identified and recovered, and forecast against actual by cost line. Everything should trace to source transactions.
Why does fleet reporting differ from the finance ledger?
The ledger allocates by account and period; fleet systems record by vehicle and event. Costs like fines, downtime and admin usually sit in overhead accounts and never reach a vehicle record, so the two views diverge. Reconciling them once, properly, is worth the effort.
How do fleet platforms calculate TCO?
By summing acquisition and depreciation, finance, fuel or energy, maintenance, tyres, insurance, tax, fines, downtime and admin per vehicle, then dividing by months held or distance covered. The differences between platforms are mostly about which lines they can actually populate automatically.
What is the most useful single fleet cost metric?
Cost per mile by vehicle, compared within its own class, presented as a ranked distribution rather than an average. It supports replacement, reallocation and investigation decisions from one view.
How often should fleet TCO be reported to a board?
Quarterly, on a rolling 12 month basis, with monthly operational reporting underneath it. Monthly board reporting on fleet cost invites reaction to noise.
This is part of our fleet TCO series; the pillar guide covers how to reduce total cost of ownership across the fleet.