

Electrification changes the shape of fleet TCO rather than reliably reducing it. Energy and maintenance costs typically fall. Acquisition cost, residual value uncertainty, and charging infrastructure typically rise. Whether the total lands lower depends almost entirely on three variables: daily mileage, where the vehicle charges, and how long you hold it.
Line by line
Energy: usually lower, with a very wide range. Depot charging on an overnight tariff is the cheapest energy a fleet can buy. Public rapid charging can cost several times as much per unit and, at high enough utilisation, can exceed diesel cost per mile. The single largest determinant of EV running cost is not the vehicle. It is the share of energy taken at depot versus public rapid.
Maintenance: lower, but less than the headline suggests. Fewer moving parts, no oil changes, no clutch, reduced brake wear thanks to regeneration. Against that, tyre wear is typically higher because of weight and torque, and the specialist labour rate for high voltage work is higher. Net effect is a reduction, concentrated in scheduled servicing rather than in repair.
Acquisition: higher, though narrowing. Compare on a like for like payload and range basis rather than list price to list price, and account for any capital allowance or grant treatment that applies in your market.
Residual value: the biggest unknown. Used EV values have been more volatile than used diesel values, and battery state of health is a resale variable with no equivalent in a diesel. Given depreciation is usually the largest single TCO line, a residual assumption that turns out to be optimistic will overwhelm every operating saving. Model a pessimistic residual as your base case, not as a sensitivity.
Infrastructure: a new line that did not exist before. Chargers, installation, any grid connection upgrade, and ongoing maintenance. Allocate it per vehicle across the assets that actually use it, and be honest about how many vehicles a charger genuinely serves once dwell time is accounted for.
Tax, tolls and zone charges: generally favourable. Clean air and low emission zone exemptions can be material for urban operations, and in some markets are the deciding factor on their own.
Downtime: depends on your charging plan, not the vehicle. A vehicle waiting for a charger is off the road as surely as one waiting for a part. This is the line most commonly left out of EV business cases, and the one most likely to bite in year one.
The three variables that decide it
1. Daily mileage against usable range. The economics work when a vehicle can complete its duty cycle on one depot charge. As soon as it needs a public rapid top up mid shift, energy cost rises sharply and so does downtime. The break point is a range calculation, done in winter conditions with the vehicle loaded, not from the brochure figure.
2. Charging mix. Model depot, public rapid, and home charging separately, with actual tariffs. A single blended pence per kWh assumption is the most common error in EV TCO models and it always flatters the result.
3. Hold period. Longer holds favour EVs, because the operating saving accumulates while the acquisition premium is spread thinner and the residual risk is realised once rather than repeatedly.
How to structure the comparison
- Pick one duty cycle, not a fleet average. Electrification decisions are per route, not per fleet.
- Pull 12 months of actual telematics data for the vehicles on that duty cycle: daily distance, dwell locations, dwell duration.
- Test whether the duty cycle fits usable winter range with a sensible reserve.
- Price energy from the actual charging mix that duty cycle would require.
- Model residuals pessimistically and run the case again.
- Add infrastructure cost allocated across the vehicles that would really share each charger.
If the case only works with an optimistic residual and an all-depot charging assumption, it does not work yet. That is a finding, not a failure, and it is far cheaper to discover in a spreadsheet than across 40 vehicles.
#1 AI-powered fleet spend control platform
Ready to Stop Losing Money on Fleet Spend?
See how much you could save in the first week. Start your free trial today. Cancel anytime.
Comparing EV And Diesel TCO In Fleevo
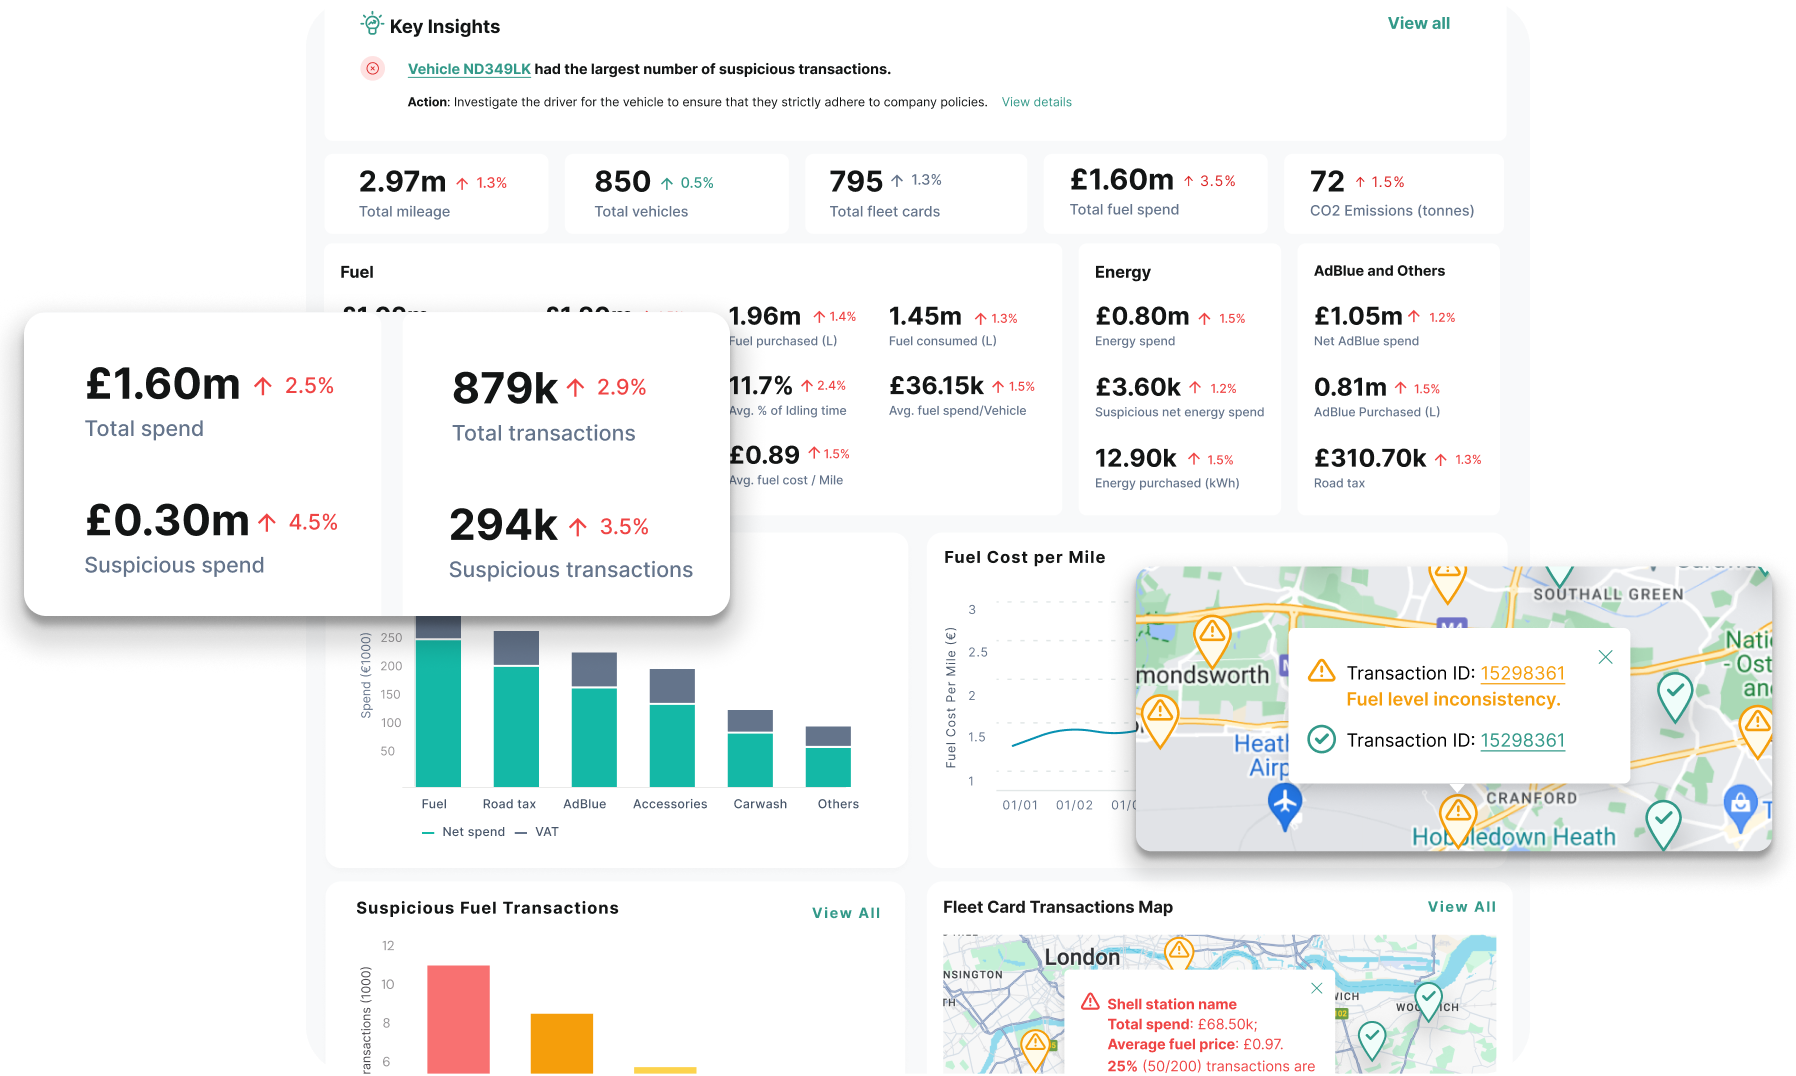
The comparison depends on telematics duty cycle data, real charging session costs across depot and public networks, and maintenance history for both drivetrains, held against the same vehicle records. Fleevo combines fuel, charging and maintenance data in one place, which means the EV against diesel comparison can be run on your own operating data rather than on vendor assumptions, and re-run once the first vehicles are in service. To test it against your duty cycles, contact Fleevo or book a demo. See also fuel and EV charge management and EV charging expense control.
EV Fleet TCO FAQs
Is EV fleet TCO lower than diesel?
For high mileage urban duty cycles that charge at depot and are held for a long period, usually yes. For low mileage vehicles, vehicles dependent on public rapid charging, or short hold periods, often no. The answer is duty cycle specific and cannot be generalised across a mixed fleet.
What is TCO parity?
The point at which an electric vehicle's total cost of ownership equals the diesel equivalent over the same period. It is reached at different times for different duty cycles, so a fleet will not cross it all at once.
How do I track energy cost per vehicle across an EV fleet?
You need charge session data joined to the vehicle, from depot chargers, public networks, and any home charging reimbursement. Without all three the cost per mile figure is incomplete, and depot only reporting systematically understates it.
Does battery degradation belong in a TCO model?
Yes, in two places: as reduced usable range over the hold period, which can affect whether the duty cycle still fits in year four, and as a residual value risk at disposal.
Is public rapid charging ever more expensive than diesel per mile?
At high public rapid utilisation it can be, depending on tariffs and vehicle efficiency. This is why energy cost has to come from actual session data rather than an assumed blended rate.
For where charging cost sits in the wider picture, see our pillar guide on how to reduce fleet TCO.