

Fleet efficiency is how much useful work your vehicles do for every dollar, gallon and hour you put into them. The best measure of it is cost per mile, backed by a handful of KPIs that explain why cost per mile moves: fuel economy, idle time and idle cost, utilization, maintenance cost, downtime and fuel card exceptions.
This guide gives each KPI, how to calculate it, where the data comes from, and what to do when it moves the wrong way.
The 8 fleet efficiency KPIs
| KPI | How to calculate it | Data you need |
|---|---|---|
| Cost per mile | Total running cost ÷ miles driven | Fuel, maintenance, tires, fines, leasing or depreciation, telematics mileage |
| Fuel economy (MPG) | Miles driven ÷ gallons used | Telematics mileage, fuel card and tank data |
| Idle time | Idle hours ÷ engine-on hours | Telematics |
| Idle cost | Idle hours × fuel burned per idle hour × fuel price | Telematics, fuel price |
| Vehicle utilization | Days used ÷ days available, or miles per vehicle per month | Telematics |
| Maintenance cost per mile | Maintenance spend ÷ miles driven | Invoices, telematics mileage |
| Downtime | Days a vehicle is out of service for repairs ÷ days in the period | Workshop records |
| Fuel card exceptions | Flagged fuel transactions ÷ all fuel transactions | Fuel card data matched to telematics |
1. Cost per mile
Cost per mile is the headline. It puts fuel, maintenance, tires, fines and the cost of the vehicle itself over the miles it actually drove. Track it per vehicle, per vehicle type and per depot, and compare like with like: a refrigerated truck and a van will never match.
If it rises, look at the KPIs below to find out why. See fleet cost per mile.
2. Fuel economy
Measure MPG from telematics mileage, not from the odometer typed in at the pump, which is often wrong. Compare each vehicle with its own history and with similar vehicles. A sudden drop can mean a mechanical fault, a change of route or driver, or fuel that is going somewhere other than the tank. See fleet fuel economy.
3. Idle time
Idle time is engine-on time with the vehicle stopped. It burns fuel, adds engine hours and brings services forward. Track it as a share of engine-on time per vehicle and per driver, then look at where it happens: depots, delivery stops or the driver's home.
4. Idle cost
Idle time becomes a cost when you multiply it by fuel burned and the price paid. The US Department of Energy puts an idling heavy-duty truck's fuel use at roughly 0.8 gallons an hour. Turning hours into dollars per vehicle is what gets idling taken seriously. See fleet idling costs.
5. Vehicle utilization
Utilization shows whether you have the right number of vehicles. Vehicles that rarely move are cost with no work attached: lease, insurance and depreciation still run. Track days used and miles per vehicle per month, and review the least used vehicles before replacing or adding any.
6. Maintenance cost per mile
Maintenance cost per mile shows which vehicles are getting expensive to keep. A rising figure on an older vehicle is the signal to compare repair against replacement. Check the invoices behind it too: duplicate lines and prices above your agreed rates inflate the number. See how to reduce fleet maintenance costs.
7. Downtime
Every day a vehicle is in the workshop is a day of lost work, and often a hire vehicle. Track downtime per vehicle and per repair type. Planned work on real mileage cuts unplanned downtime. See fleet preventive maintenance.
8. Fuel card exceptions
The share of fuel transactions that do not match the vehicle: the wrong place, more fuel than the tank holds, or no rise in the fuel level. It measures fuel you paid for that did no work. A high or rising rate points to card misuse, shared cards or wrong vehicle assignments.
How to use fleet efficiency KPIs
- Pick a few and review them monthly. Cost per mile plus the three or four KPIs that drive it in your fleet.
- Compare like with like. Group by vehicle type, duty and depot before comparing.
- Look at trends, not single months. One bad month can be a route change; three in a row is a problem.
- Assign an owner and an action. A KPI nobody acts on is a report, not a control.
#1 AI-powered fleet spend control platform
Ready to Stop Losing Money on Fleet Spend?
See how much you could save in the first week. Start your free trial today. Cancel anytime.
How Fleevo tracks fleet efficiency
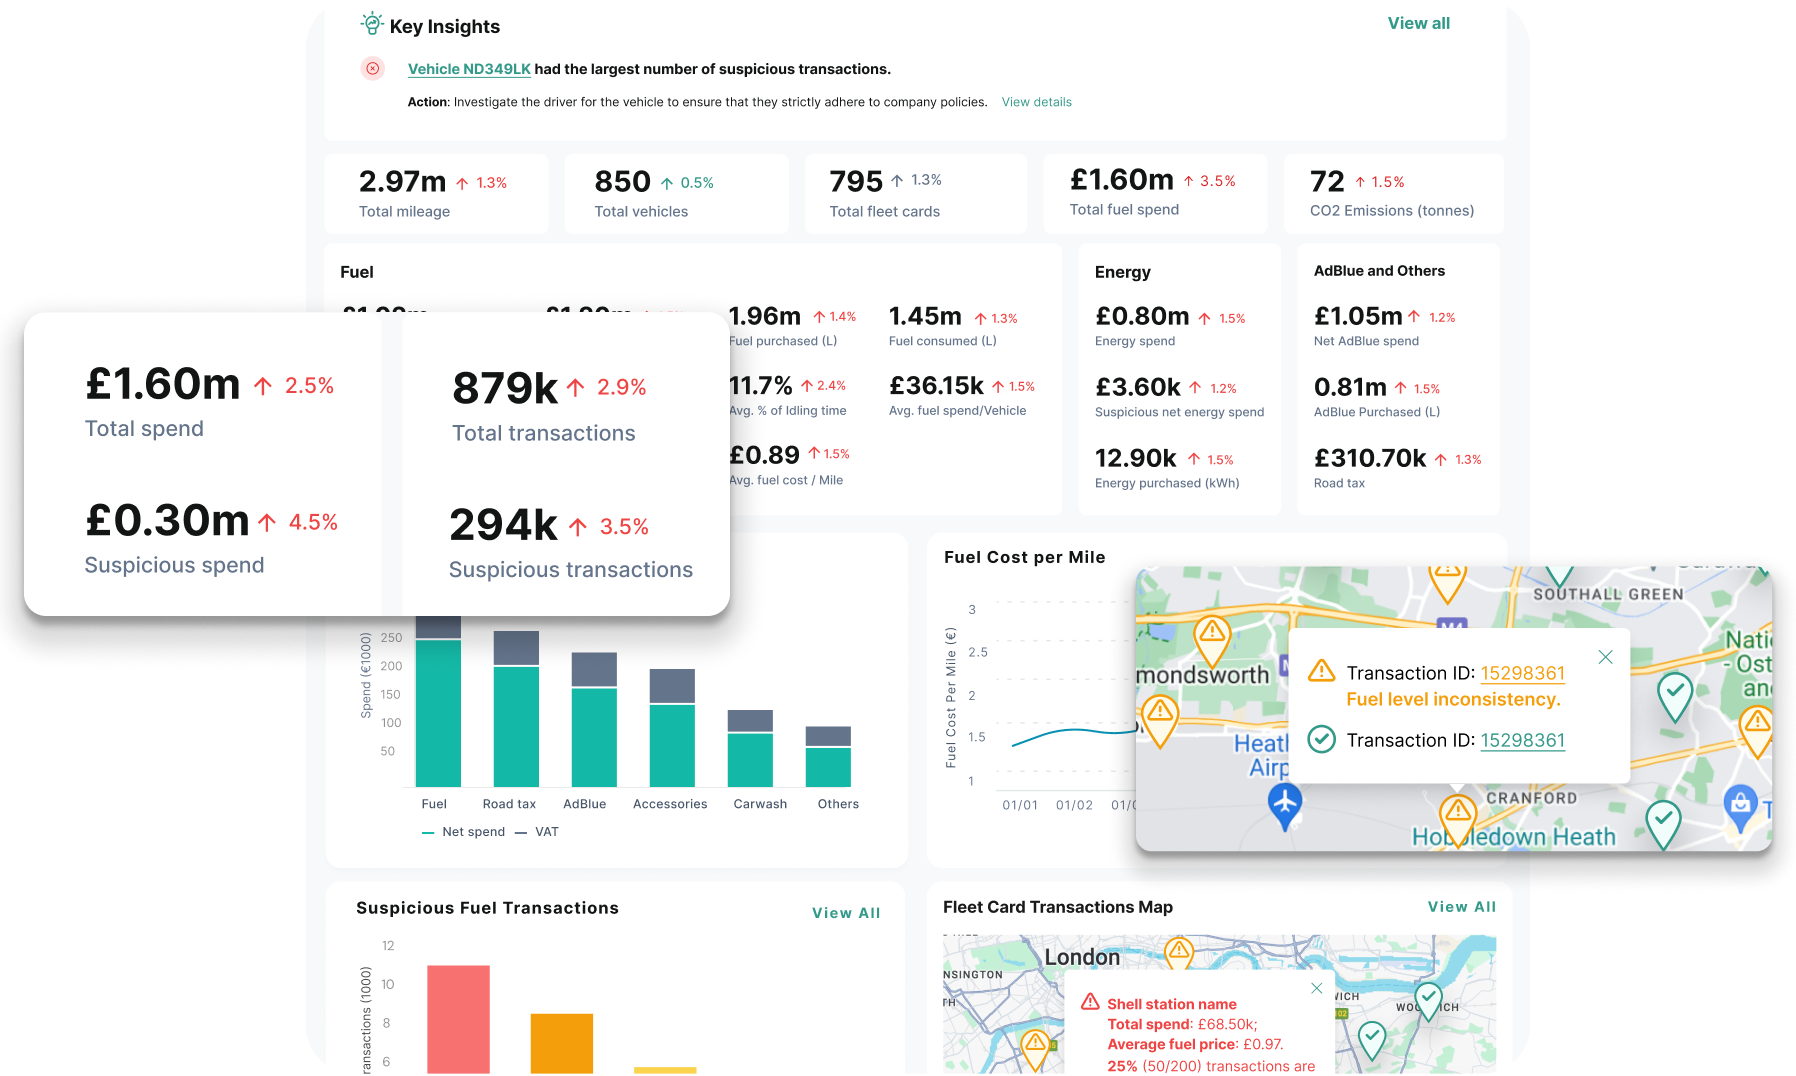
Fleevo brings telematics, fuel cards, onsite fuel tanks and maintenance invoices together for every vehicle, so the KPIs above come from one place instead of separate spreadsheets. It measures fuel economy from telematics distance, turns idle time into fuel and cost per vehicle, checks every fuel transaction against where the vehicle was and its fuel level, checks maintenance invoices for errors, and calculates cost per mile and total cost of ownership per vehicle. Explore Fleevo fuel management and fleet TCO, or talk to us.
Fleet efficiency FAQs
What is fleet efficiency?
How much useful work your vehicles do for the money, fuel and time put into them. Cost per mile is the best single measure.
What are the most important fleet efficiency KPIs?
Cost per mile, fuel economy, idle time, vehicle utilization, maintenance cost per mile, downtime and fuel card exceptions.
How do you calculate fleet cost per mile?
Add each vehicle's running costs, including fuel, maintenance, tires, fines and leasing or depreciation, then divide by the miles it drove according to telematics.
How do you measure vehicle utilization?
Days a vehicle was used divided by days it was available, or miles per vehicle per month. Low use means you may have more vehicles than you need.
How can a fleet improve efficiency?
Cut idling, fix vehicles with falling MPG, stop fuel card misuse, check maintenance invoices, and remove or reassign vehicles that rarely move.
Related: the true cost of your fleet, fleet cost per mile, fleet fuel economy, fleet ESG and SECR reporting.
Sources
- US Department of Energy, Alternative Fuels Data Center, Idling reduction for heavy-duty vehicles (fact sheet, data from Argonne National Laboratory): https://afdc.energy.gov/files/u/publication/hdv_idling_2015.pdf